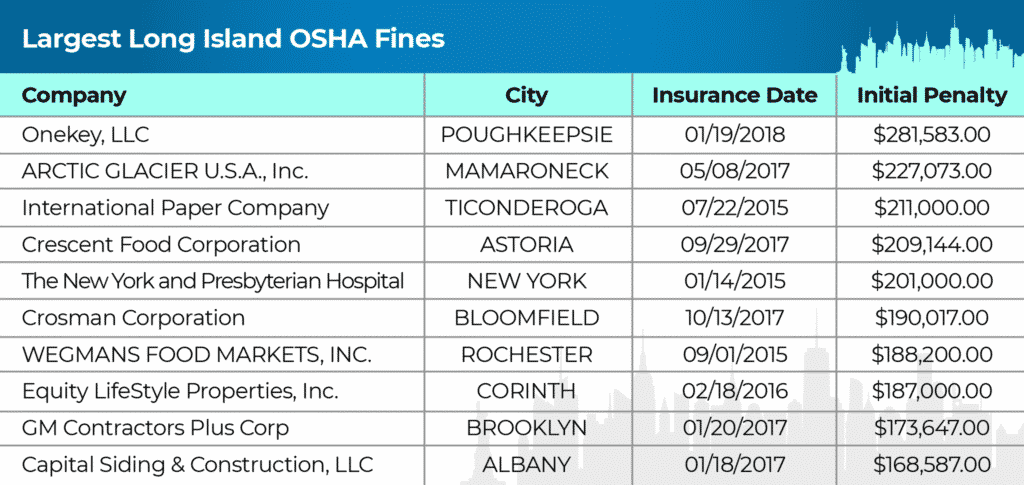
Notes: Addresses are not necessarily of businesses that committed violations but where they committed the violations. Businesses with multiple locations (ie Walmart) are on the map once but violations across all locations are counted.
Ever see that big, laminated chart in your office break room? You know, the one describing what workplace safety regulations you are legally entitled to and how to report an unsafe workplace? That is the result of efforts of the Occupational Safety and Health Administration (OSHA), whose job it is to inspect and enforce safety in the workplace. However, before 1970, you would not have had such enforcement, nor any government agency to report unsafe working conditions to. The US Congress created the OSHA in 1970, as a part of the Department of Labor, in response to public outcry from increasing numbers of injuries and illnesses at workplaces across the country, and, by and large, the program has been successful at reducing incidents and workplace injuries since its inception 48 years ago.
The OSHA points to a couple of stats (below) to indicate the effectiveness of the program:
- Worker deaths in America are down-on average, from about 38 worker deaths a day in 1970 to 14 a day in 2016.
- Worker injuries and illnesses are down-from 10.9 incidents per 100 workers in 1972 to 2.9 per 100 in 2016.
OSHA Violations By the Numbers – Long Island Case Study
Over the past 10 years, the Occupational Safety and Health Administration (OSHA) has levied out 7000 violations to businesses on Long Island, for various job site infractions in a wide range of industries. On the island, from 2007 – 2017, the OSHA found violations within 18 different NAICS Industry Sectors. The numbers over the years follow a pretty consistent pattern. Construction was by far the greatest offender, followed by Manufacturing. All others industry sectors, such as Information and Health Care, have a drastically smaller contribution to the total infraction numbers.
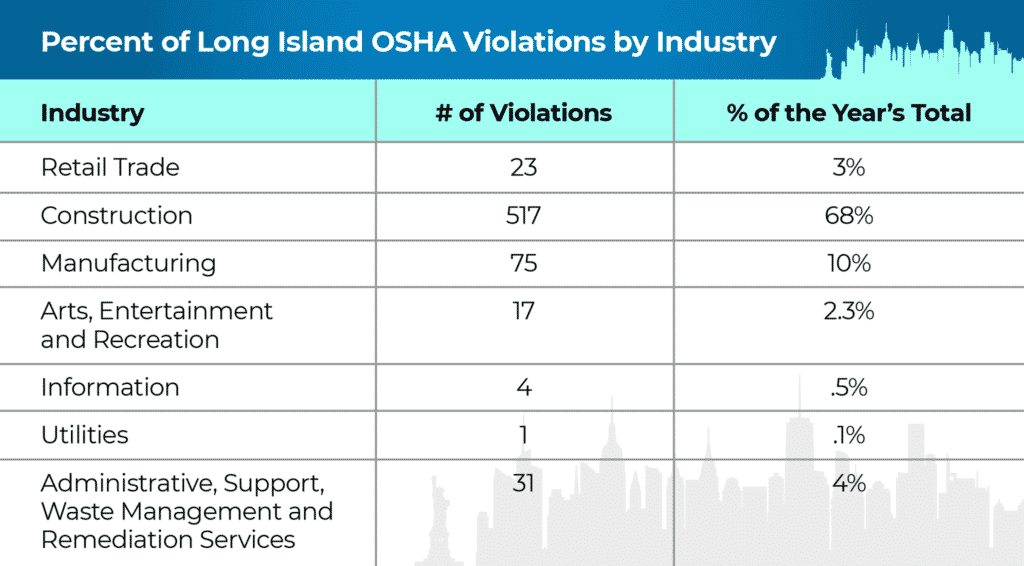
For example, in 2014 there were 755 OSHA Violations. A small sample breakdown of the violations can be seen in the table below:

Over the 10 years of data analyzed, this proportional distribution of infractions remained pretty consistent, with Construction and Manufacturing receiving the most violations, and all other industries receiving far less.
Yearly Changes
In the last two years, 2016 and 2017, the total number of violations per year dropped significantly for Long Island based companies. Prior to that, from 2007 – 2015, the violations did fluctuate, but were still significantly higher than the most recent examples, and averaged 700+ violations per year as seen in the table below:

While we probably can’t attribute the sudden decrease to a single source, particularly the extremely low numbers in 2016, it does seem likely that the fine increases, passed in 2015 and enacted in 2016 had something to do with it.
In 2015, Congress passed the Federal Civil Penalties Inflation Adjustment Act Improvements Act to adjust for inflation, and to maintain the effectiveness of the penalties. The new law directed agencies to adjust their penalties for inflation each year using a much more straightforward method than previously available, and required agencies to publish “catch up” rules to make up for lost time since the last adjustments.
The rules published under the 2015 law had the following effects:
- OSHA’s maximum penalties, which had not been raised since 1990, increased by 78 percent. The top penalty for serious violations rose from $7,000 to $12,471, per violation. The maximum penalty for willful or repeated violations increased from $70,000 to $124,709.
- OWCP’s penalty for failure to report termination of payments made under the Longshore and Harbor Workers’ Compensation Act, had only increased $10 since 1927, and rose from $110 to $275.
Not that employers desired to have unsafe workplaces, but it does seem convenient that the moment pocketbooks and bottom lines become threatened, Long Island companies committed the least number of safety violations in years.
Disparity Between Industries
Our analysis found that every year, the construction industry in Long Island has landed between 40% to a whopping 78% of the total OSHA fines for the year. Over the 10 years analyzed, construction companies accounted for 3,938 violations out of the 7,001 in that time frame (56%). Of course, this is likely due to the nature of the job. First and foremost, construction is a far more dangerous job than most other industries. This leads to far more safety regulations both within private companies, and as part of the general legal code. An industry that has more inherent risk and far more hazardous conditions, combined with greater numbers of regulations, simply leads to more potential for infractions. Likely this is an accepted fact of the industry.
The manufacturing industry has also incurred a significant proportion of the fines given out by OSHA on the island. Over the 10 years, manufacturing received 1,572 violations (22% of the total for that period of time). Similar to construction, manufacturing can involve heavy machinery, and potentially dangerous working environments, undoubtedly leading to the larger amount of violations than other industries
By contrast, other, less dangerous industries, received far less infractions. For example, Finance and Insurance received a total of 2 OSHA violations from 2007 – 2017, and Education Services received a total of 4. Both industries having little to no inherent danger in the nature of the job and minimal safety restrictions that could lead to violations. No hard hats required, no safety lines needed. When all you basically have to do to be compliant is put in a fire extinguisher and have an emergency exit route, it’s a lot easier to stay on the good side of the OSHA.
The Biggest Offenders

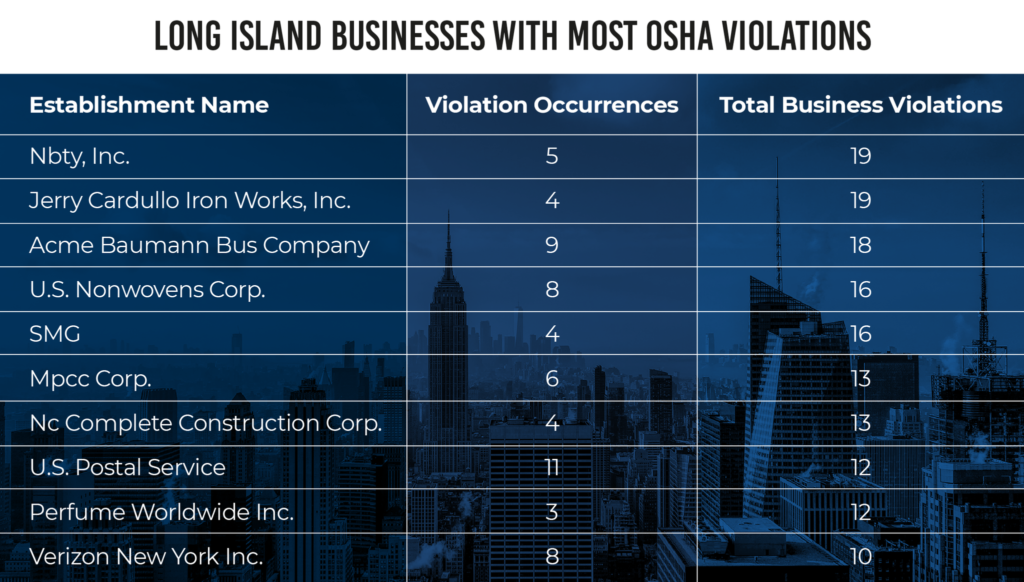
Some businesses have significantly more violations, and many more years with a violation than others. Our research found that large corporations with multiple job locations, often had many years with at least 1 violation reported, which is not surprising considering they have much greater opportunity to be reported. For example, the US Postal Service had complaints filed in 7 of the 10 years analyzed, and Verizon had complaints filed in 8 of the 10 years reported. However, for both organizations, none of the violations were particularly serious. In addition, each year reported usually had only one or two offenses cited.
On the other hand, some of the smaller businesses had the largest offense numbers, and greatest seriousness. Paint & Decoration Inc. racked up the worst record over the ten year period. With 15 violations in 2010 totalling $224,600 15 Violations in 2013, totalling $460,350, and 31 violations in 2008 totalling $80,000. A majority of the individual violations by Paint & Decoration Inc. were general safety requirements, such as capacity limits on lifts and scaffoldings or meeting the numerous safety precautions required for commercial scaffolding. It should also be noted that the large fine amounts are the result of repeat offenses, which are significantly larger than first time offenses.

While no other company record analyzed had the same volume as Paint & Decoration Inc. many organizations were similar to the case of Avalon Gardens Rehabilitation Health Care Center, a care center for elderly persons with health issues. Avalon Gardens was cited for 2 violations in 2007, 7 violations in 2010 and 13 violations in 2013, with fine totals of $1,350, $3,375 and $24,600 respectively. Violations encompassed a wide range of issues, including general safety requirements, improper handling of medical and health equipment and insufficient emergency exit standards.
It would be hard to say it is surprising that construction and manufacturing pose the biggest threat to workplace safety. However, the good news is that not only are workplace safety standards higher nationwide than in 1970, but if Long Island is any indication of national trends, recent developments have further reduced the number of violations, creating a safer and better workplace, no matter what industry.

